01
How it is used
Air-conditioning engineers use the chart to estimate humidification, heating, cooling and dehumidification processes.

A psychrometric diagram for understanding the properties and processes of moist air.
A psychrometric diagram for understanding the properties and processes of moist air.
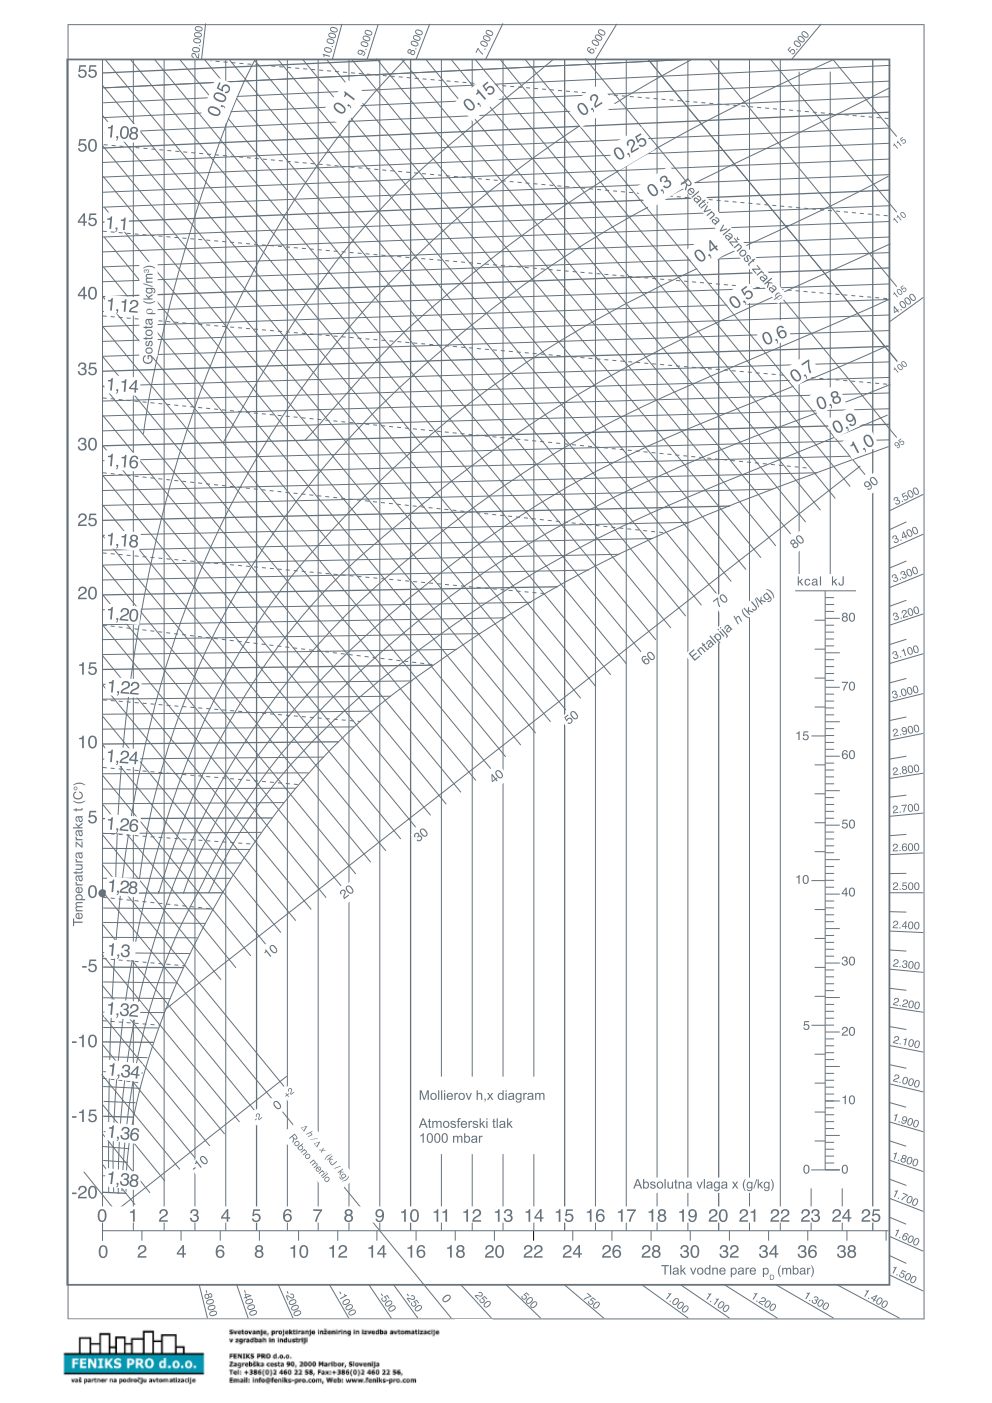
Air-conditioning engineers use the chart to estimate humidification, heating, cooling and dehumidification processes.
Use the chart together with applicable engineering equations and verified operating conditions.
A Mollier diagram visualises the relationship between the temperature, moisture content and enthalpy of moist air. Engineers use it when analysing heating, cooling, humidification and dehumidification processes in HVAC equipment.
The diagram is specific to its assumed pressure and units. The archived JPG remains available in the resources section.