Meters, e-invoices and PDFs in one place
A consistent overview of locations, buildings, energy types and cost centres.
ElnetWEB+ brings together meter readings, e-invoices, PDFs and other key sources for monitoring consumption, costs, anomalies, market prices and advanced analytics.
Measurements alone do not deliver savings. Meaningful comparisons, anomaly detection, cost analysis and operational action provide the basis for better energy management.
A consistent overview of locations, buildings, energy types and cost centres.
Alerts for missing data, exceeded thresholds, abnormal load profiles and other relevant events.
Beyond kWh: understand tariffs, periods, prices and market developments.
Custom reports for management, controlling, internal users and tenant billing.
Bring together the measurements and documents that matter to your building, portfolio and business.

Consumption, demand, loads, 15-minute profiles and meter comparisons.
Water flow, readings and unusual consumption patterns.

Metered volumes and comparisons with building or production operation.

Heating and cooling in comparable periods.
Collection of electronic bills and PDF documents for structured accounting data.

Monitoring compressed-air consumption and operation in industry.
Additional sources for cost analysis, optimisation and reports.
A well-designed EMS does more than show consumption: it explains costs, demand patterns, market movements and the impact of operating improvements.
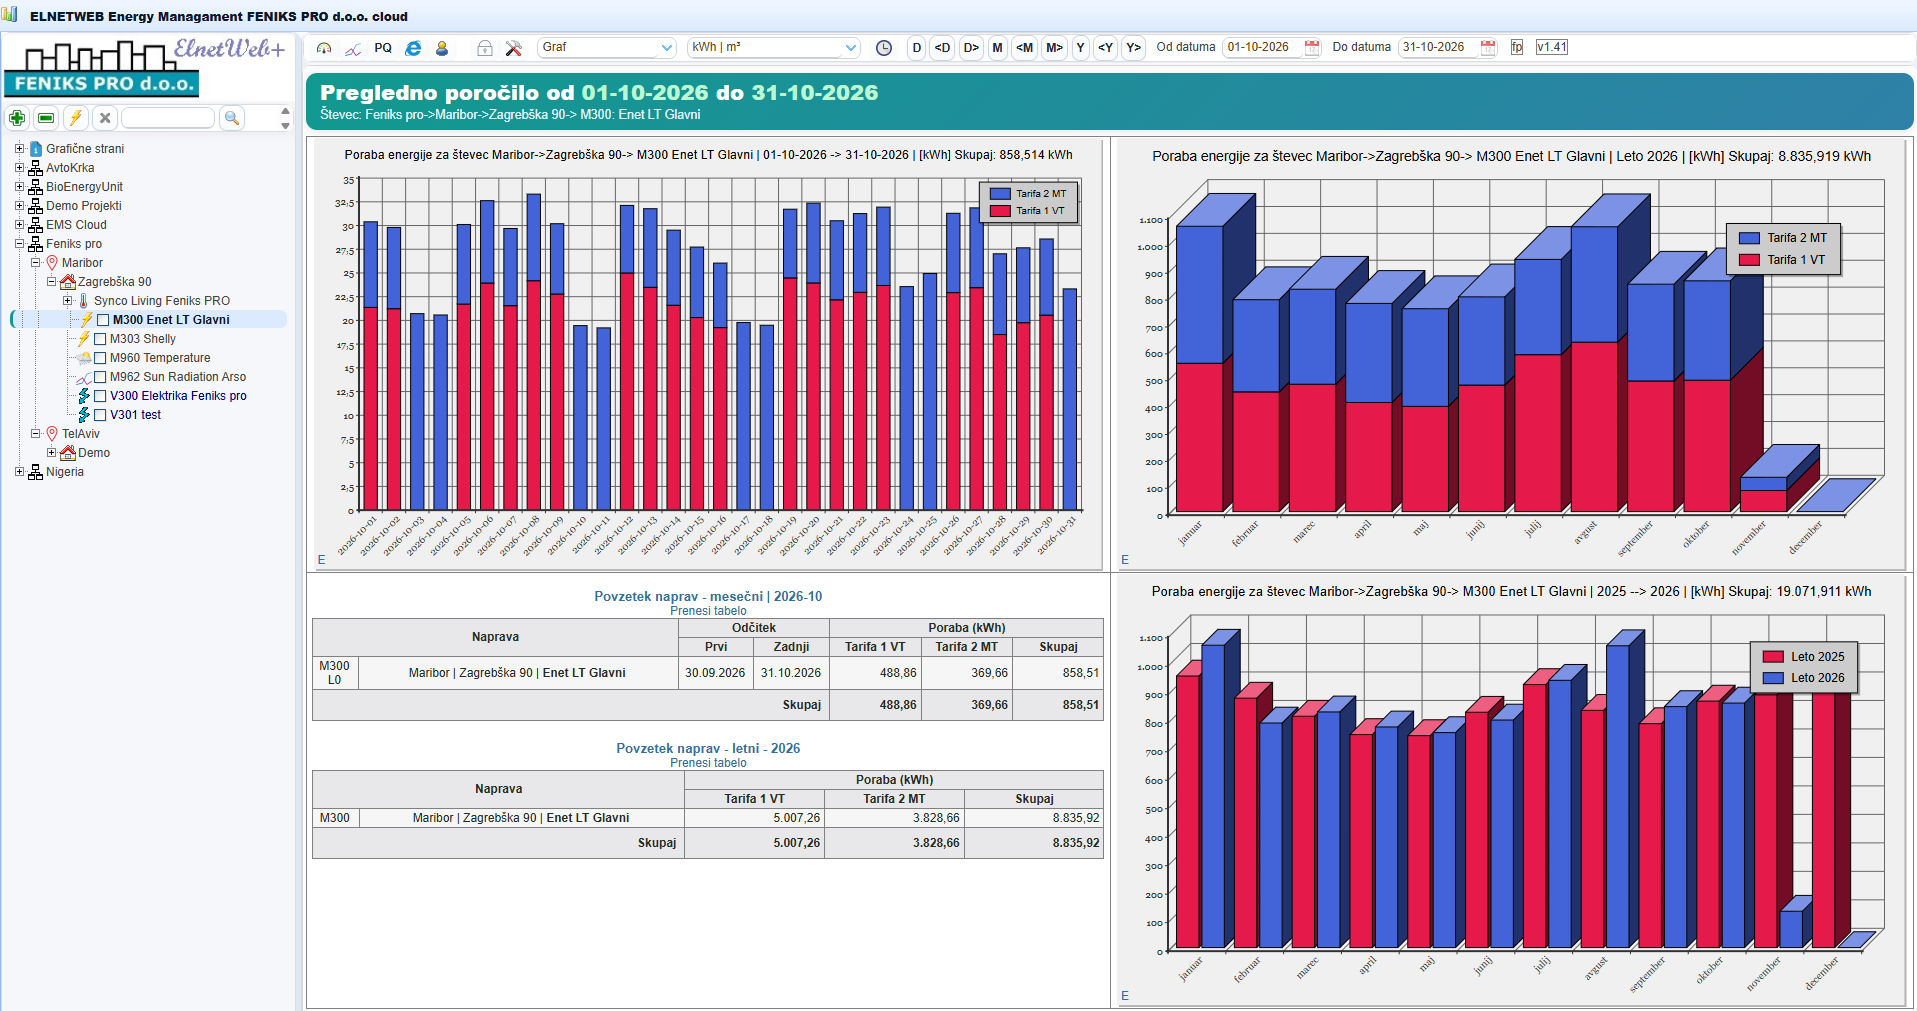
Daily, monthly and annual reports, tariff comparisons and summaries by meter support cost monitoring, billing and management reporting.
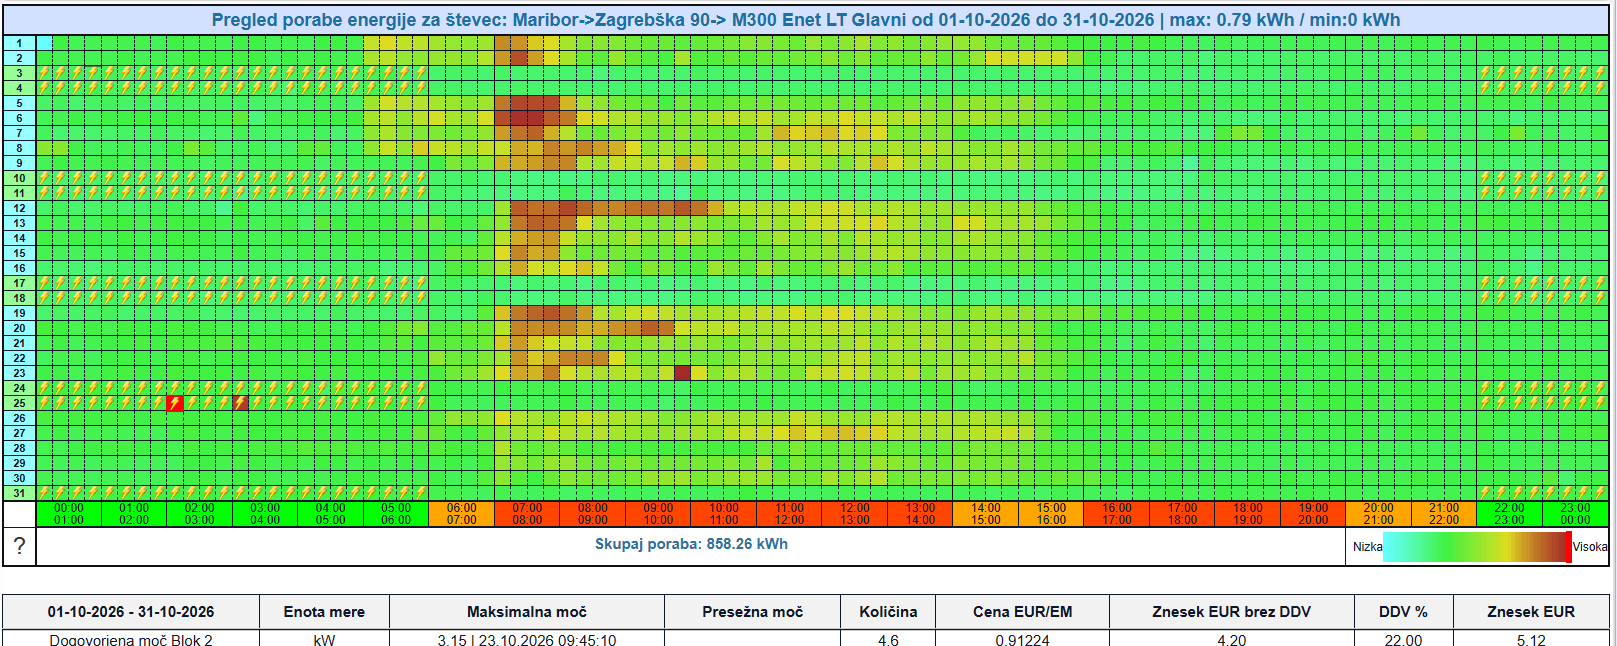
Heatmaps highlight nighttime loads, morning demand peaks, repeated exceedances and other unusual patterns. A clear view of energy use over time.
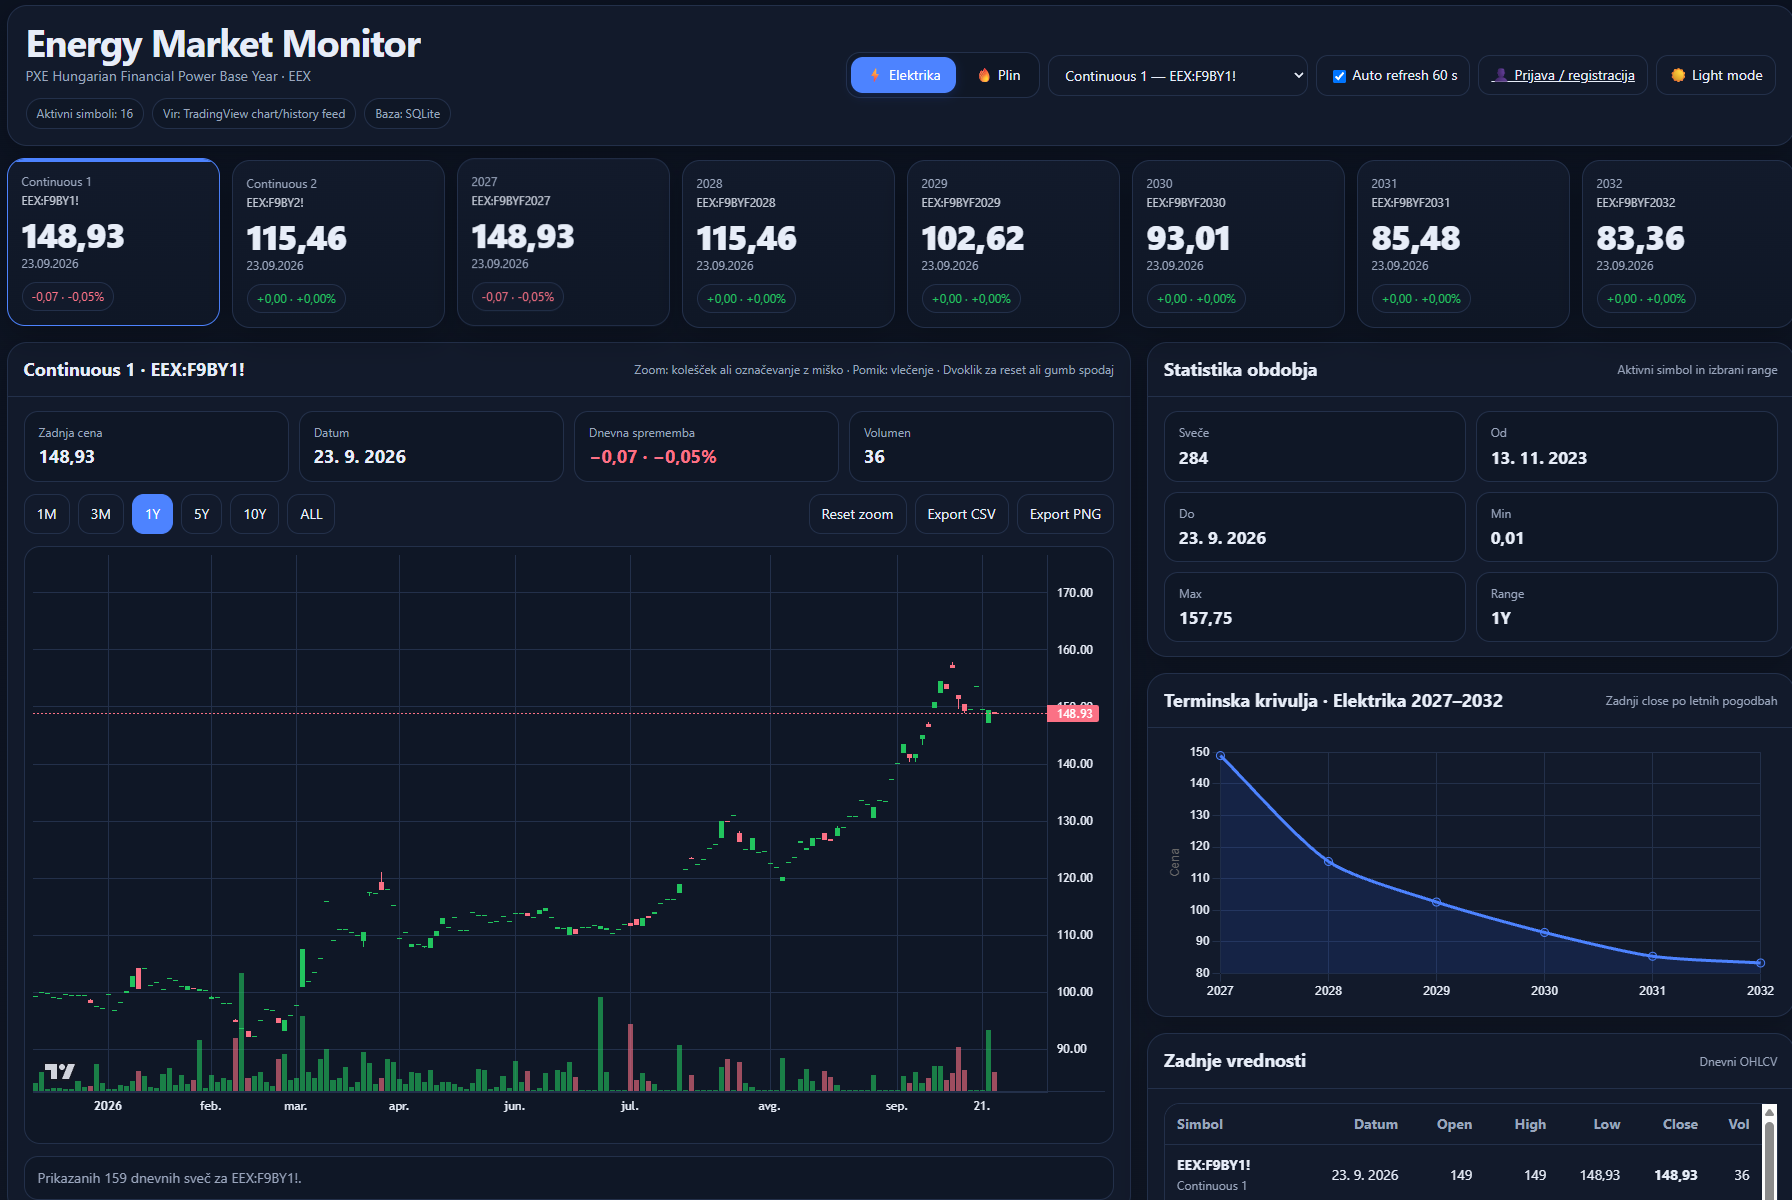
Market quotations, forward curves and price developments provide useful context for energy purchasing, cost planning and market monitoring.
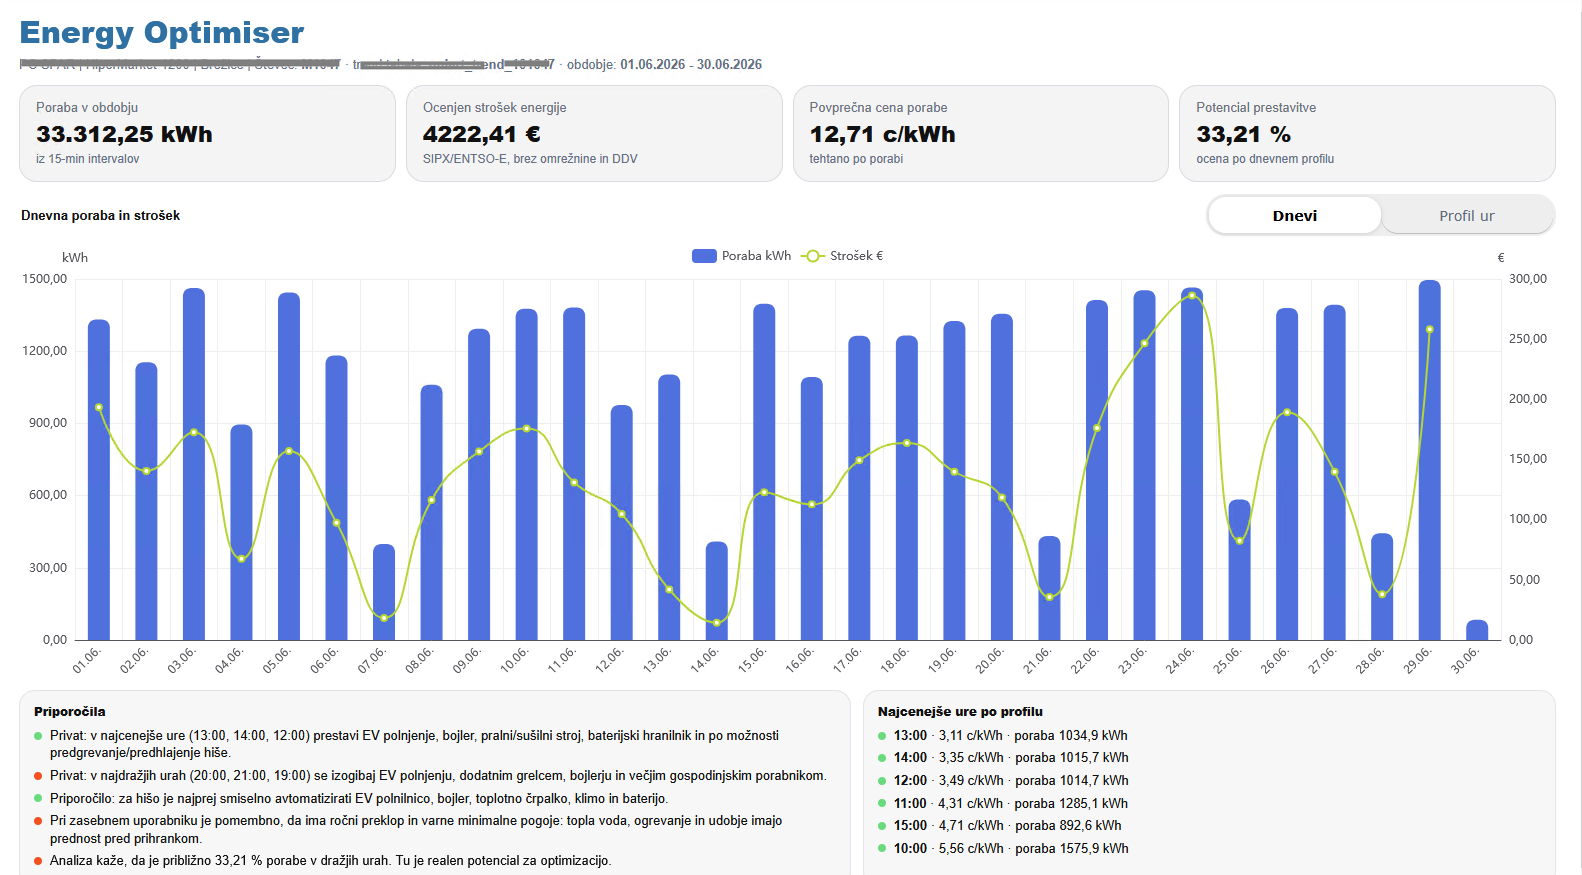
Combine energy use, costs and hourly patterns to identify opportunities to shift loads, review equipment schedules or evaluate further improvements.
A broad set of functions supports demanding energy-management and reporting tasks.
Minimum, maximum and average over selected intervals; 15-minute, hourly, daily and monthly profiles with cross-site comparisons.
Weather normalisation using HDD and CDD helps distinguish operating improvements from changes in outside temperature.
Indicators in kWh, m³, EUR, CO₂ and other relevant units, depending on source data quality and configuration.
Import 15-minute readings, connect existing supervisory systems, use Modbus/M-Bus and, where appropriate, pulse or optical meter reading.
Tenant and internal billing, data export and, where suitable measurement equipment is installed, power-quality analysis and EN 50160 reporting.
Monitor generation, demand, export and storage, supporting tailored optimisation and controlling reports.
Available functions depend on metering hardware, data quality, integrations and configured modules. Monitoring alone does not guarantee savings or standards compliance.
Energy management across many stores takes more than consumption charts: reliable acquisition, custom reporting, cost analysis and portfolio visibility all matter.
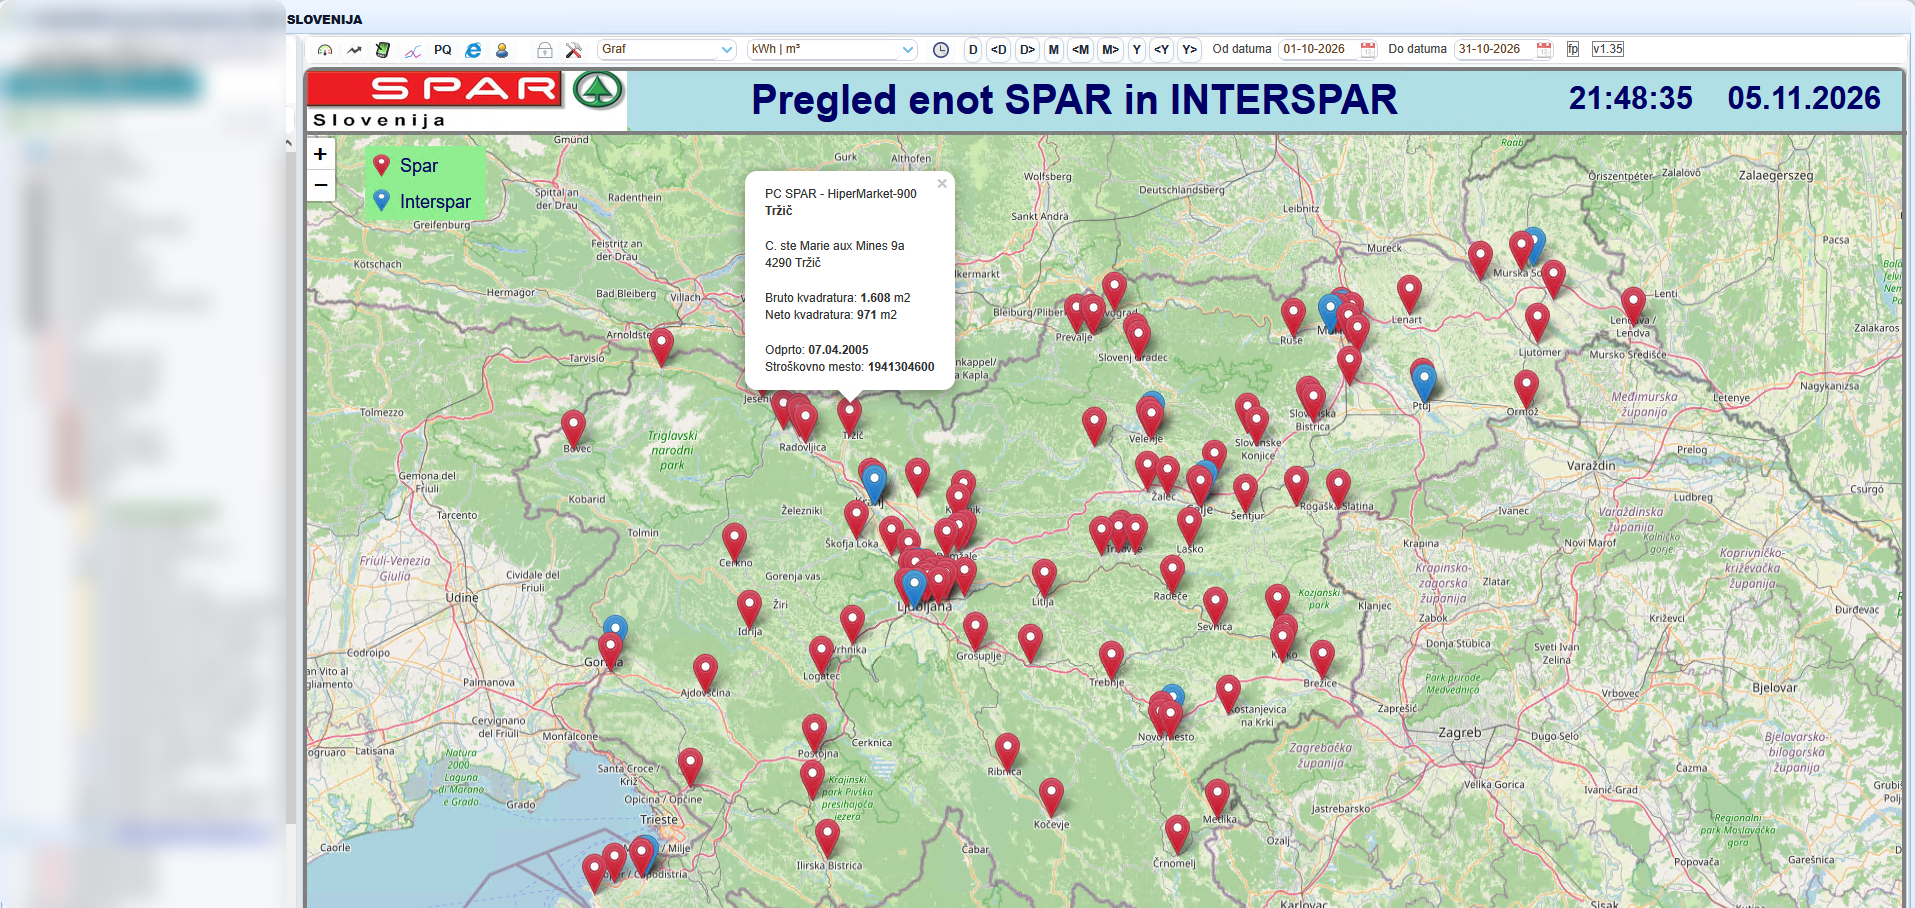
For SPAR Slovenia, ElnetWEB+ supports monitoring and analytics for an extensive store portfolio, including reporting beyond standard meter dashboards.
Monitor and compare a large number of locations through one platform.
Electricity, water, gas, heat and other relevant measurement points.
Document collection with extended billing and analytics views.
Reports for management, controlling, tenants, solar PV, battery storage and advanced analyses.
From retail and industry to public institutions, our energy monitoring solutions support a wide range of operational needs.
ElnetWEB+ collects data from meters, e-invoices and existing systems. Depending on the installation, sources can include Modbus, M-Bus, pulse or optical reading, portals such as Moj elektro, and SCADA/BMS integration.
Deployment and access are designed around infrastructure, security requirements, site count and daily operations.
Select indicators that matter for each building or portfolio.
Compare consumption across locations, operating schedules and systems in one environment.
Review demand peaks and the use of electricity, gas, water, heat and other important utilities.
Organise metering and cost data for management reporting, controlling and tenant billing.
ISO 50001:2018 provides a structured approach to improving energy performance: set objectives, implement measures, verify outcomes and improve continuously. ElnetWEB+ supplies the measurement and analytical foundation.
Identify significant energy uses, establish baselines, define energy performance indicators (EnPIs) and objectives.
Implement energy measures, improve operating schedules and manage consumption.
Analyse trends, compare results against baselines and investigate deviations.
Take corrective actions, report to management and improve the next action plan.
Within an agreed scope, FENIKS PRO can assist with metering architecture, energy reporting and technical data preparation for energy audits and management-system assessments.
Directive (EU) 2023/1791 sets requirements based on average annual energy consumption across all energy carriers over the previous three years:
Slovenia's Energy Efficiency Act (ZURE) requires large companies to conduct energy audits every four years and report to the Energy Agency. Under specified conditions, an appropriate certified management system can satisfy the audit obligation.
The exact duties depend on current Slovenian implementing legislation and the organisation's circumstances. ISO 50001 certification is issued by an independent certification body.
From meters and billing documents to indicators, comparisons, reports and improvement plans.
Further reading: ISO 50001:2018 · Directive (EU) 2023/1791 · Slovenian Energy Agency.
Organised consumption data supports energy audits, internal reporting and energy-efficiency improvements. It can support an ISO 50001 energy-management process but does not itself establish certification or compliance.
Advanced analysis can combine consumption, costs, hourly patterns, period comparisons and recommendations for further action.
Explore case studiesExplore real projects and applications where energy monitoring or management is documented.
SPAR SlovenijaElnetWEB+ EMS – retail portfolio ↗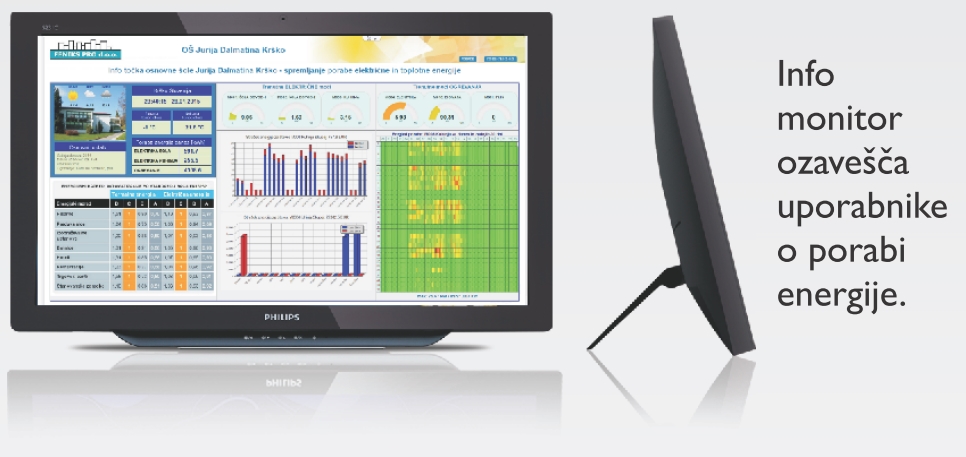 OŠ Jurija Dalmatina, KrškoEnergy monitoring – reference ↗
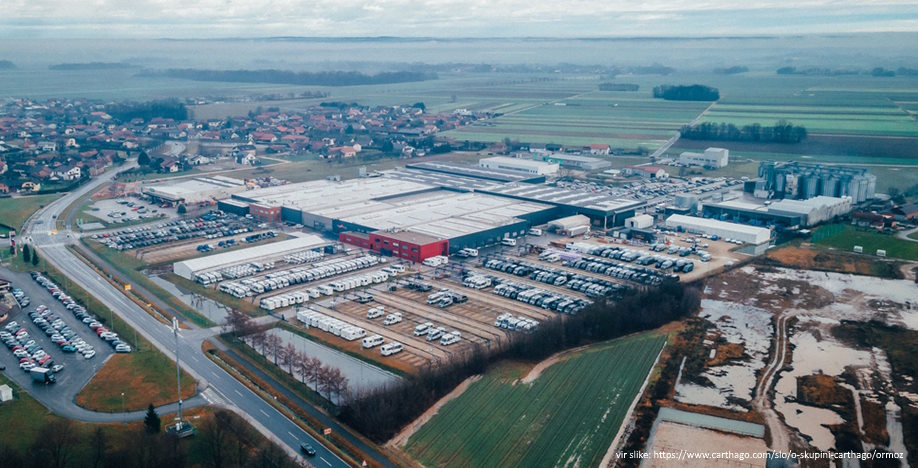 Carthago OrmožMetering and BMS integration – reference ↗
A project reference does not imply a specific savings percentage. Any actual savings must be measured and verified.
We first review existing equipment, documents and operational needs.
Not necessarily. We first inspect the existing meters and interfaces, reuse suitable data sources and add hardware only when required.
Yes. ElnetWEB+ supports data collection and analysis across meters, buildings and sites, adapted to the infrastructure and access permissions.
Yes. Depending on the project, e-invoices and PDFs can be collected and processed for reporting for management, controlling, tenants and other workflows.
Yes, where relevant. Data sources can be extended with market information and alert rules for anomalies, missing data and exceeded thresholds.
Tell us about your buildings, meters, locations and other data sources. We can explore an EMS solution that fits your requirements.